Chart Items
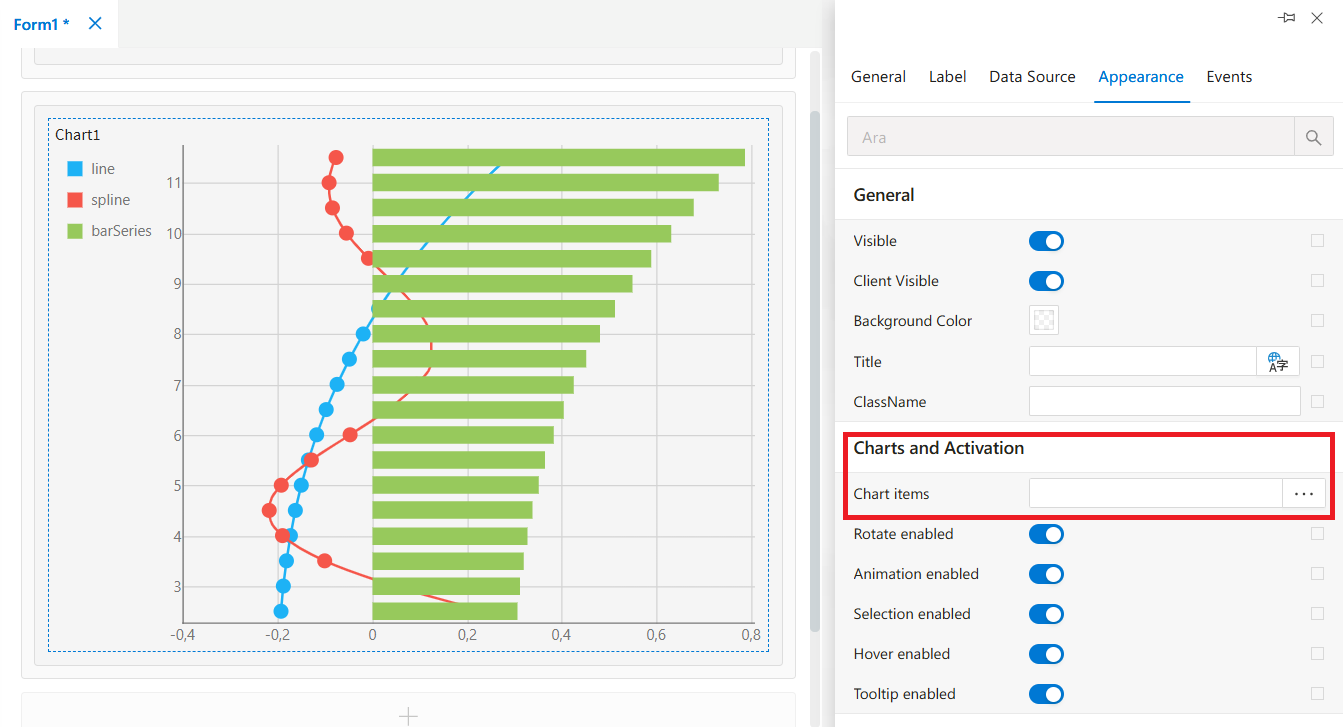
The Chart Items property is used to select and configure the chart types that will be displayed inside the Chart control.
This panel allows adding multiple chart types (except Pie) and configuring their fields, colors, and display settings.
Chart Items
The Chart Items area is where developers define which chart types will be shown inside the Chart component.
When the Chart Items field is clicked, a configuration window opens, allowing the user to add, remove, or edit chart definitions.
By clicking the “Add” button inside this window, a list of available chart types is shown.
The Chart control supports the following chart types:
Area ChartBar ChartLine ChartPie ChartScatter ChartSpline Chart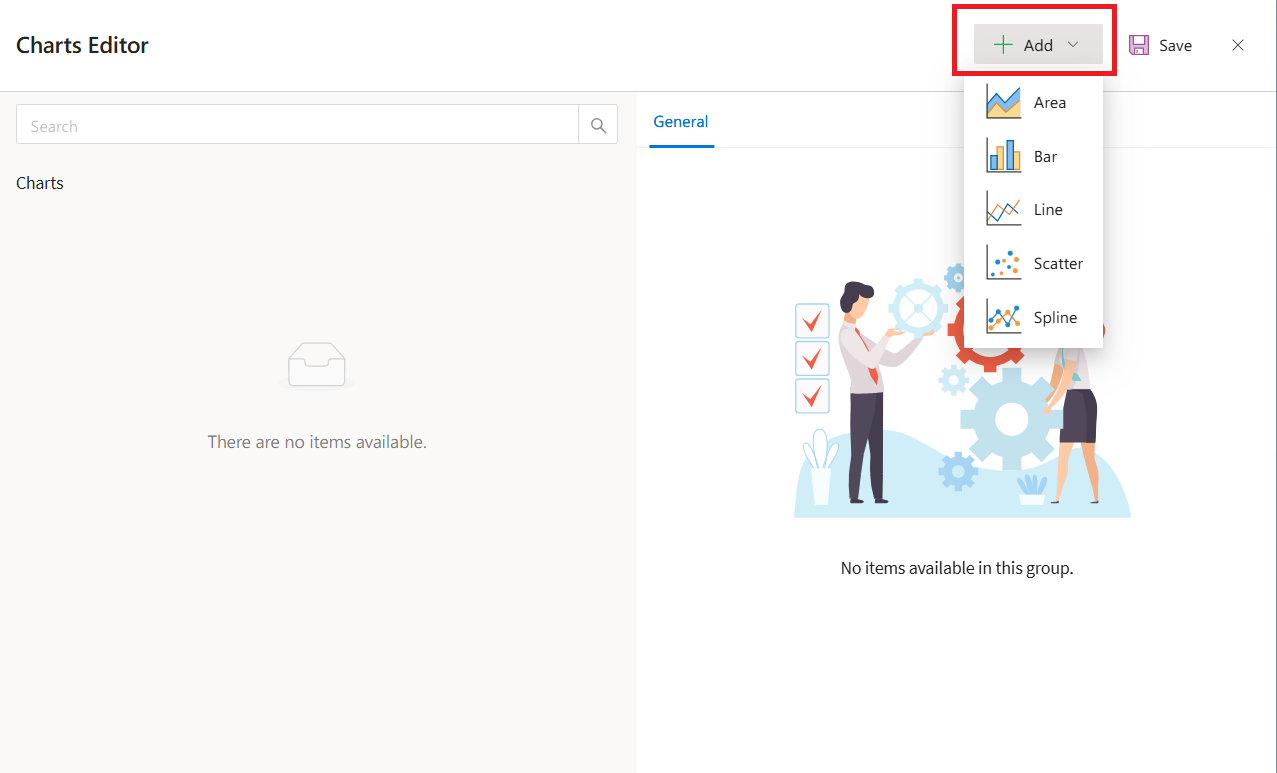
Important Information
Note:
ThePie Chartcannot be used together with other chart types.
If a Pie Chart is added, no additional chart types can be included.
How It Works
- Click
Chart Itemsin the properties panel. - A configuration window opens.
- Click
“Add”to choose a chart type. - When a chart is added, it appears in the
left panelunder the Grafikler (Charts) section. - The
right paneldisplays the selected chart’s editable properties.
Chart Item Properties
| Property | Description |
|---|---|
Name | The unique name to be assigned to the chart is entered here. |
Argument Field | The column representing the description (category) field in the chart’s data source is selected here. |
Value Field | The value column to be retrieved from the chart’s data source is selected. |
Color | The color of the chart is set here. You can choose from the color panel or enter RGB / HEX codes. The “A” value represents the Alpha Channel and controls opacity (0–100). |
Color Selection Details
- Click the color box to open the color picker panel.
- Select a color from the palette or enter:
RGBformatHEXformat- Adjust transparency using the
Alpha (A)slider.
- You can also choose from
15 predefined default colors.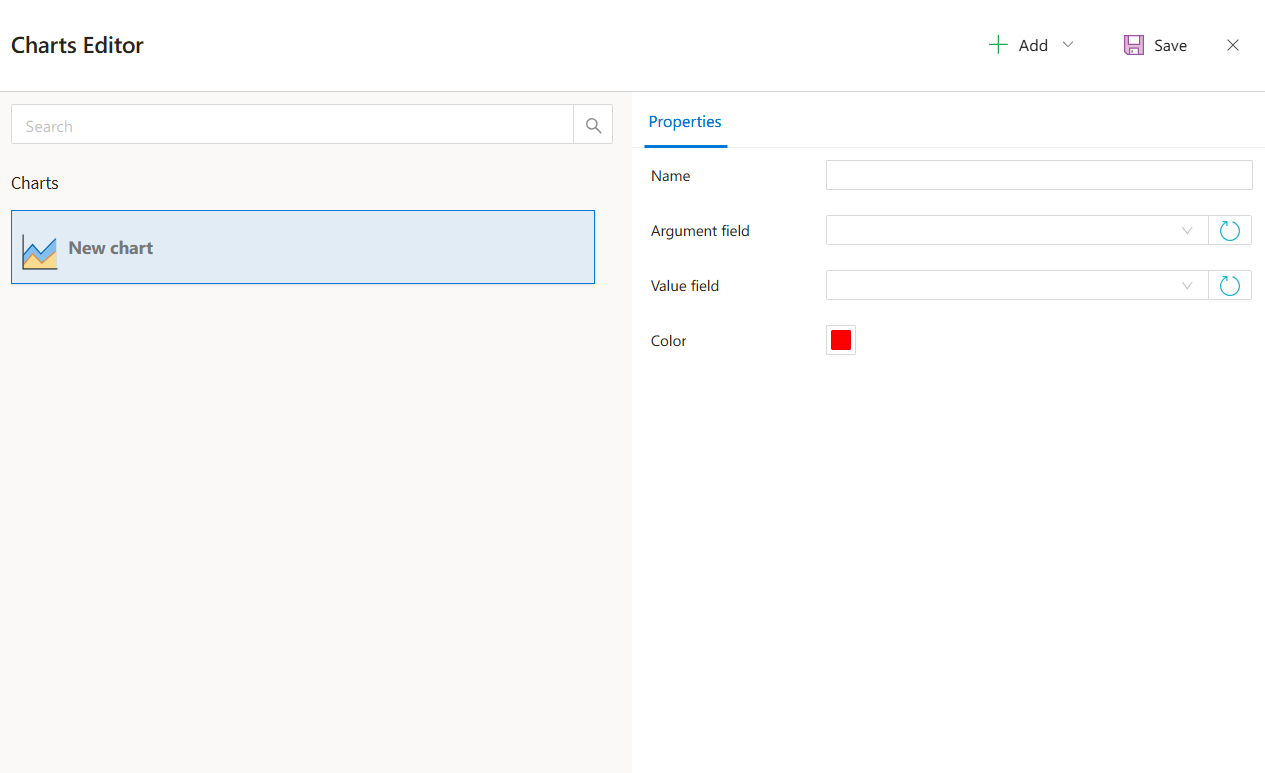
Saving the Chart
After configuring all required fields:
- Click
“Save”to save the chart definition. - The chart will appear in the Chart control according to its configuration.
Summary
The Chart Items property provides full customization of the Chart component, including:
- Selecting chart types
- Binding fields to dataset columns
- Customizing chart colors
- Supporting multiple visualizations (except Pie in combination)
This makes the Chart control a powerful tool for data visualization within Synergy forms.